Key performance indicators emphasize what drives competitive value for internal & external stakeholders and how. These KPI’s map against internal business processes, tools, technologies, and systems. Things that are not described are either considered missing or underutilized; a fatal error if actually correct. Discussions of key performance indicators (KPI’s) that drive business value to face similar challenges.
KPI’s, Data, and Strategy

Key performance indicators describe an ideal state. Data is used to help describe whether or not that ideal state has been achieved. If the ideal state has not been achieved, data seeks to identify the existing gap. It clarifies what gap exists between the current and ideal state.
KPI’s are not a strategy. The team is required to apply more evaluation tools. They must reference appropriate models to better understand the data. Context is everything.
Describing the Problem

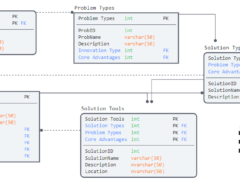
Business consulting tools aim to evaluate the model being used. They identify missing elements and suggest opportunities for improvement. Physical artifacts and interviews are conducted. Discussions are facilitated. And insights are gained through the integration of observation, report, an assumption.

The business consultant begins with a tiered approach. They aim to map the business’ ‘verbal world’ upon available artifacts. This helps create a conceptual model. The subjectivity of this process is highlighted by the reliance on verbal confirmation. A challenge that key performance indicators (KPI’s) also share.
Managing Constraints

Key performance indicators, when applied, face the same constraints as a project. Cost, Quality, and Scheduling KPI’s are often in conflict with one another. This value incongruence can be difficult to balance unless strategic leadership (and the customer) agree on priorities. Is the priority quality? Or cost? Or the schedule? Evaluating KPI performance in isolation, meaning one KPI in isolation from the larger system, introduces randomness. Studying the data will not explain why the KPI’s are underperforming. A systems model is required.
Risk Assessment
Another way to discuss conflicting KPI’s is to conduct a risk assessment. First identify what risks exist, followed by an evaluation of their probability and impact. Many customers will seek to shift the risk to the business or supplier. They want them to figure out how to manage the risk. The goal is for all the KPI’s to be ‘realized exactly as defined.’ Unfortunately, this does not solve the conflict.
Value Congruence
KPI’s evaluated without a systems model, or without a consensus around how these are prioritized, also introduces competition. Externalizing risks to the producer may not be an option. These conflicts introduce hidden costs as the business model applies previously anticipated resources to fix the performance issue. Opportunity costs are similarly created as resources are pulled from other efforts. The results are unsustainable.
KPI Systems

A systems approach to identifying, evaluating, and governing key performance metrics is suggested. This approach supports alignment, planning, and performance. It also limits unexpected conflicts. Additionally, it addresses value incongruities and unsustainable or marginal returns on investment. A systems approach begins with identifying the process for delivering a specific output. Similar to a work breakdown structure, a KPI process map identifies the interdependencies. It also shows the connections between each key performance indicator tracked.
Priorities must be established. Risk management must be performed. This is necessary for the KPI process map to achieve alignment. Conflicts either require re-evaluation of priorities or re-engineering of process steps in which the deliverable is created. The following chart can be used to document the project’s KPI work breakdown structure.
| KPI Code | KPI Name | KPI Measure | Dependencies |
| KPI1 | |||
| KPI2 | KPI1 | ||
| KPI3 | KPI1, KPI2 | ||
| KPI4 | KPI1, KPI2, KPI3 | ||
| KPI5 | KPI1, KPI2, KPI3, KPI4 | ||
| KPI6 | KPI1, KPI2, KPI3, KPI4, KPI5 | ||
| KPI7 | KPI1, KPI2, KPI3, KPI4, KPI5, KPI6 | ||
| KPI8 | KPI1, KPI2, KPI3, KPI4, KPI5, KPI6, KPI7 |
LEAN & Process Engineering

The Lean methodology is most well-known for its emphasis on eliminating the 7 wastes. These wastes are overproduction, waiting, transportation, over-processing, inventory, motion, and defects. Beginning with a process map the team attempts to understand what wastes are available.
Once these wastes have been identified, the next step is for the team to modify the process. They need to remove the unnecessary elements. The same can be applied to a KPI process map where conflicts are observed. The KPI process map can also be used to evaluate waste (misalignment) and opportunities for improvement. Removing waste may also improve KPI alignment and reduce the impact of remaining KPI conflicts.
Conclusion
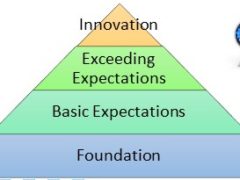
Key performance indicators distinguish performance vectors that create a competitive advantage versus those that only ‘meet expectations.’ The quality of a KPI depends on its necessity. Its legitimacy relies on alignment with stakeholder priorities. It must support business goals. Poorly planned KPI systems perpetuate competing goals, values, and thus outcomes despite best intentions. A more coherent approach is needed.
Poorly planned KPI systems lock-in poor performance and constraint the environment’s ability to introduce innovations. Systems are constantly changing. This constant change makes it even more difficult to align poorly performing KPI metrics. Increasing the KPI system’s coherence and alignment makes finding opportunities for improvement easier. It also simplifies solving performance issues as they surface.
Travis Barker, MPA GCPM
Innovate Vancouver
Innovate Vancouver is a Technology and Business Information Consulting Service (TBICS) located in Vancouver, BC. Contact Innovate Vancouver to help with your new project.